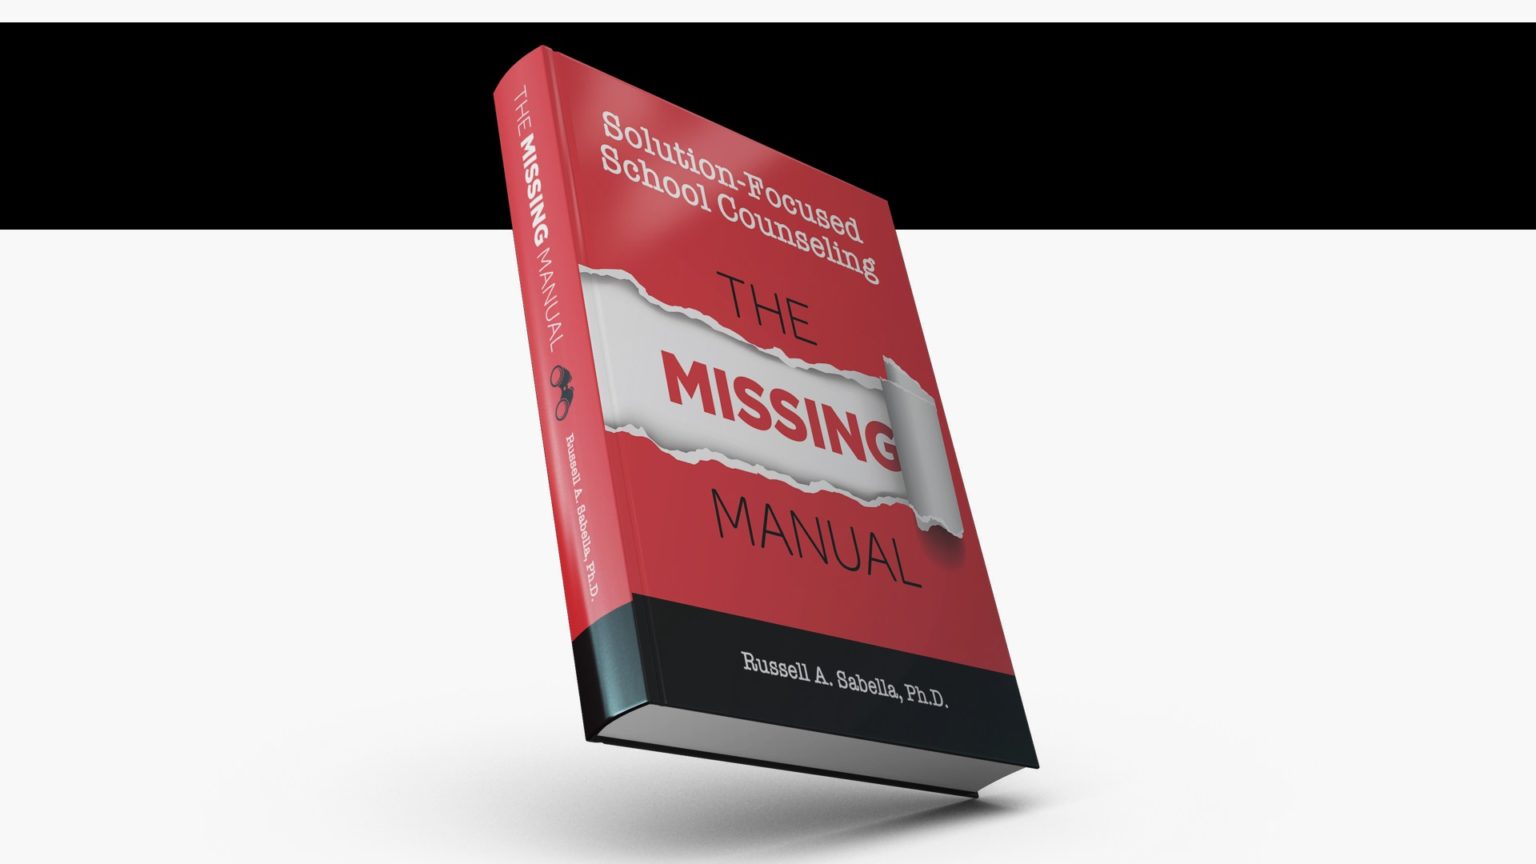
Brand new from Russ Sabella!
Solution-Focused School Counseling: The Missing Manual
https://schoolcounselor.com/themissingmanual/
 Create Compelling Charts: A Picture Is Worth 1000 Words
All Practice Levels
All Experience Levels
Discover several easy ways to create charts using Microsoft Excel and other productivity tools. Then, learn how to disseminate your charts within reports, presentations and online. After attending this session, you should be able to: 1) Distinguish between bar, line, pie, waffle and other charts types. 2) Create a bar chart in two clicks using Microsoft Excel. 3) Use pivot tables to compare different charts. 4) Customize the look of your chart with colors, font, logos, etc. 5) Animate and narrate your chart as part of your digital story.
 Download a PDF of the PowerPoint. You will want this for two reasons. First, the presentations continue to be updated from month to month and you can come back and download a fresh copy in the future. Second, you can click on many of the slides which will take you directly to the resources, tools, or other information you need. Click here to view.
- Develop a Narrated, Self Advancing, Multimedia Closing the Gap Report (Webinar Replay from ASCA)
- Russ’s Online Full Day Workshop: Data Boot Camp 2.0. Click here to see an introductory video.
- Chart Suggestions—A Thought-Starter (PDF).
- Creating a thermometer chart in Microsoft Excel (video).
- F11 Trick for Creating Bar Charts (video).
- Using “Recommended Charts” feature in MS Excel (video).
- Using “Quick Analysis” feature in MS Excel (video).
- Creating an “Icon” Chart Using PowerPoint (video).
- Creating infographics with Piktochart. See examples from the CASC.
- Create A Graph from Kids’ Zone.
- Online Graph Maker ChartGo is an easy to use chart tool.
- Create Charts Quicker by Saving Chart Templates in Excel (video).
- How to Spot a Misleading Graph (video).
- Chart Chooser from Juice Analytics. Use filters to find the right chart type for your needs, then download as Excel or PowerPoint templates and insert your own data.
- More videos on creating charts from YouTube.
- Highline Excel 2013 Class Video 41: Review Of Chart Basics For Excel 2013 (video).
- Play Your Charts Right: Tips for effective data visualization.
LA Technology Fitness (Tech Tips, Tricks, and Shortcuts for School Counselors)
All Practice Levels
All Experience Levels
Come join the club and get tech fit. Increase your Microsoft Office and Adobe activity levels and get buff with productivity and information apps. Run add-ons, add-ins and extensions across various applications. Lunge into a better of way of delivering, communicating, promoting, and managing your work using technology. After attending this session, you should be able to: 1) Explain how to quickly sort, disaggregate and analyze data using Microsoft Excel. 2) Identify two technologies for producing more polished materials. 3) Identify three innovative ways to Page 22 of 46use Microsoft Word. 4) Use Google apps such as Voice and Scholars.
 Download a PDF of the PowerPoint Presentation. (PDF)
BIG Handout (Google DOC)
- PDF Tricks
- Download Foxit Reader.
- PDF Tricks (video).
- PDF Tools (Merge, Split, Convert).
- PDF Mergy (Quick way to merge PDF documents).
- Convert Web Page to PDF (Web2PDF)
- Remember, you can open a PDF with Microsoft Word and it will automatically convert.
- Microsoft Word
- Google Scholar (APA References).
- Language Translation (video).
- Use Styles for four different reasons (video)
- A terrific video tutorial about Word Tricks (video).
- Getting content into your document FAST
- AutoCorrect (video)
- Insert as a Quick Part (video)
- Use the Word Clipboard
- Grab and drop a screen shot (video)
- Email or Document Merging (video).
- See if a template already exists for your needs here.
- Customize Quick Access Toolbar (video)
- Navigating Online
- Speed Dial your Chrome Browser (video)
- Chrome Extensions
- Russ’s Favorite Add-ins and Plug-Ins (DOC)
- Other Productivity Tools
- Download Them All with WaterFox Browser
- Email extractor lite.
- Coordinate your times of availability with When2Meet. Here is a quick video for this one.
- Optical Character Recognition (OCR) (video)
- Develop Surveys and Collect Data with Google Forms – ASCA Webinar
- Outlook Email
- Outlook Email: 5 Tips in 5 Minutes (or Less) (video): 1. Create a calendar event from an email. 2. Create a contact entry from an email. 3. Copy someone in an email while still typing your email using the “@” sign. 4. “Clean up” an email conversation. 5. Use Quick Parts to draft an email that you send out repeatedly.
Datability Workshop
- Download PDF of the PowerPoint.
- Click here to download Auto Closing the Gap (AutoCTG) Report Creator.
- ASCA RAMP Resources (Webpage)
- EZAnalyze (ADDIN)
- ASAP-Utilities (Webpage; Free for Home and School use).
- Online full day data boot camp (Webpage).
If you want solution focused professional development for your school or district, visit our PD page to view the possibilities for helping you to work more effectively, efficiently and more enjoyably. Click here for our most popular training topics.
Advanced Google Form Tips and Tricks
Get answers to next-level questions about using Google Forms throughout your school counseling program. Learn to automatically turn your collected data into emails, letters, forms and more. Discover how you can use Google Forms for automatically graded pre-/post-tests, and how to develop a Google Form item bank to reduce repetition. Learn to share your forms with others without letting them edit your original work.
- PDF of the presentation (PDF)
- Instructional videos used in the presentation on YouTube
- More technology tips, tricks, and shortcuts! (WEB)
If you have not already, sign up for my free newsletter to get periodic tips, tricks, and shortcuts that will make your life easier:


 Dr. Russell A. Sabella is currently a Professor in the Department of Counseling in the College of Education, Florida Gulf Coast University and President of Sabella & Associates.